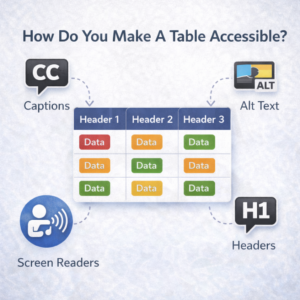
How Do You Make A Table Accessible?
Imagine listening to a data table. How long would it take before you lost track of the information? How would you orient yourself again?
Creating accessible tables involves simplifying the layout, using header rows, and providing clear descriptions. Good contrast, readable text, and proper structure help ensure the table is inclusive and easy to navigate.
Headings
Labels on the first row across the top of each column identify the contents of that column. Some tables have row labels (down the first column) as well. Assistive technology users can access properly constructed table headers to keep track of individual data cells within the context of the table data.
When you create a table in Canvas, the Accessibility Checker lights up with two prompts. One reads “Tables should include at least one header” and offers a drop-down to make the first row, the first column, or both, into table headers.
Descriptions
The second prompt asks you to provide a summary description of the table: “Tables should include a caption describing the contents of the table.”
Complex tables – those with merged cells, headers that span multiple rows or columns, large empty sections, nested tables, or other complex design elements – will need additional changes. If you have complex tables, contact UDC for a consultation to Make An Appointment via Bookings.
Simple Tables vs Complex Tables
Documents: Creating Accessible Tables Guide (pdf)
Web: Tables